The Ocean as a Carbon Sink—and What That Costs
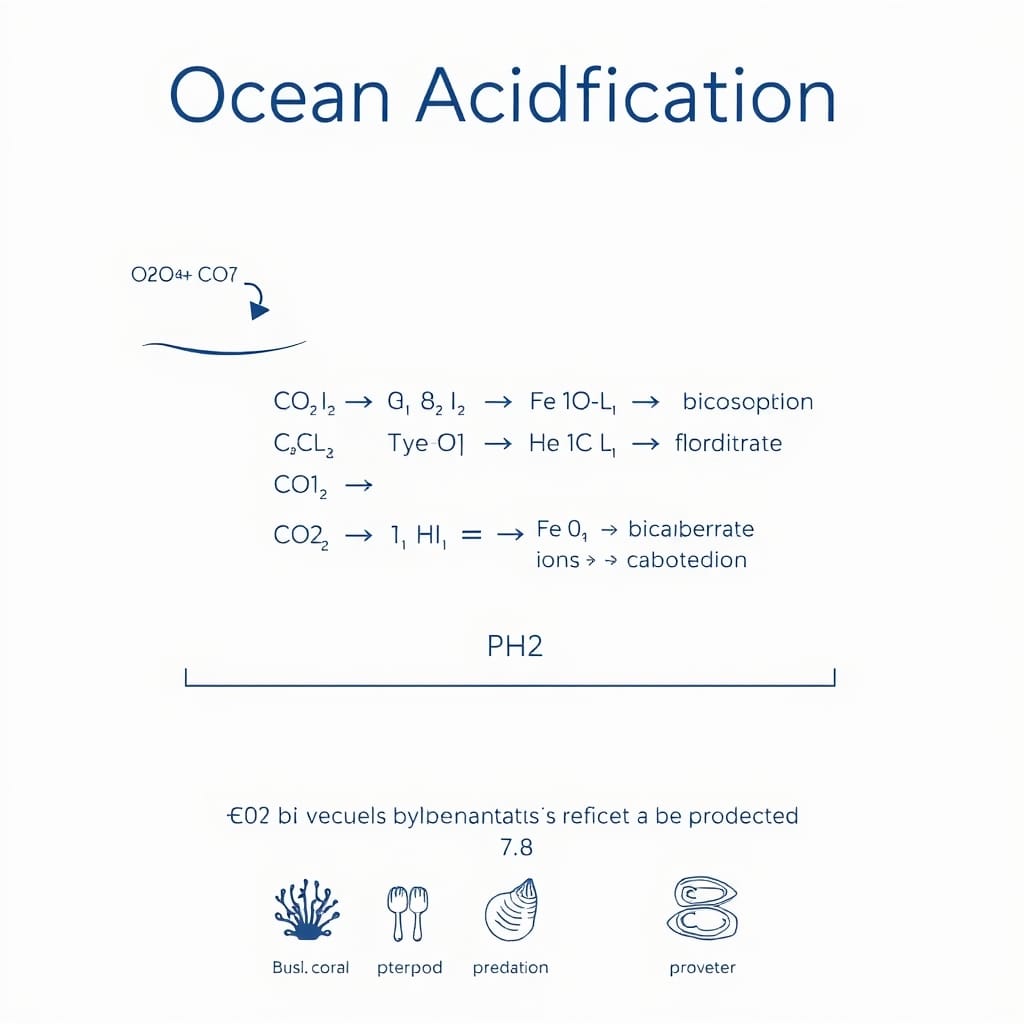
The ocean has absorbed an estimated 25–30% of all human-emitted carbon dioxide since industrialization began. This buffering service has slowed atmospheric warming, but it comes at a measurable chemical price. When CO₂ dissolves in seawater, it reacts with water to form carbonic acid (H₂CO₃), which then dissociates into bicarbonate (HCO₃⁻) and hydrogen ions (H⁺). More hydrogen ions mean a lower pH—the definition of acidification.
Since the pre-industrial era, average surface ocean pH has dropped from approximately 8.2 to about 8.1. That shift of 0.1 pH units corresponds to roughly a 26% increase in hydrogen ion concentration, because the pH scale is logarithmic. The rate of change is faster than anything reconstructed from the geological record over the past 300 million years, giving marine organisms little evolutionary time to adapt.
The Chemistry in Detail
Understanding ocean acidification requires following the carbonate chemistry step by step.
The Carbonate Equilibrium
When CO₂ enters seawater, the following sequence occurs:
- CO₂ + H₂O → H₂CO₃ (carbonic acid)
- H₂CO₃ → H⁺ + HCO₃⁻ (bicarbonate)
- HCO₃⁻ → H⁺ + CO₃²⁻ (carbonate ion)
The extra hydrogen ions produced in steps 2 and 3 react with available carbonate ions (CO₃²⁻), converting them back to bicarbonate. This reduces the concentration of carbonate ions in the water—a critical problem for calcifying organisms.
Aragonite and Calcite Saturation
Many marine organisms build shells and skeletons from calcium carbonate (CaCO₃), which exists in two mineral forms: aragonite and calcite. Aragonite is more soluble and is used by corals, pteropods (free-swimming sea snails), and many mollusks. Calcite is used by echinoderms and some plankton.
The saturation state (Ω, omega) of seawater with respect to these minerals determines whether shells form or dissolve. When Ω drops below 1.0, the water becomes corrosive to that mineral—shells and skeletons begin to dissolve faster than they can be built. Aragonite saturation states in parts of the Arctic and Southern Ocean are already approaching or seasonally dipping below this threshold.
Which Organisms Are Most Vulnerable?
Not all marine life responds the same way. Sensitivity depends on physiology, life stage, and local conditions.
Corals
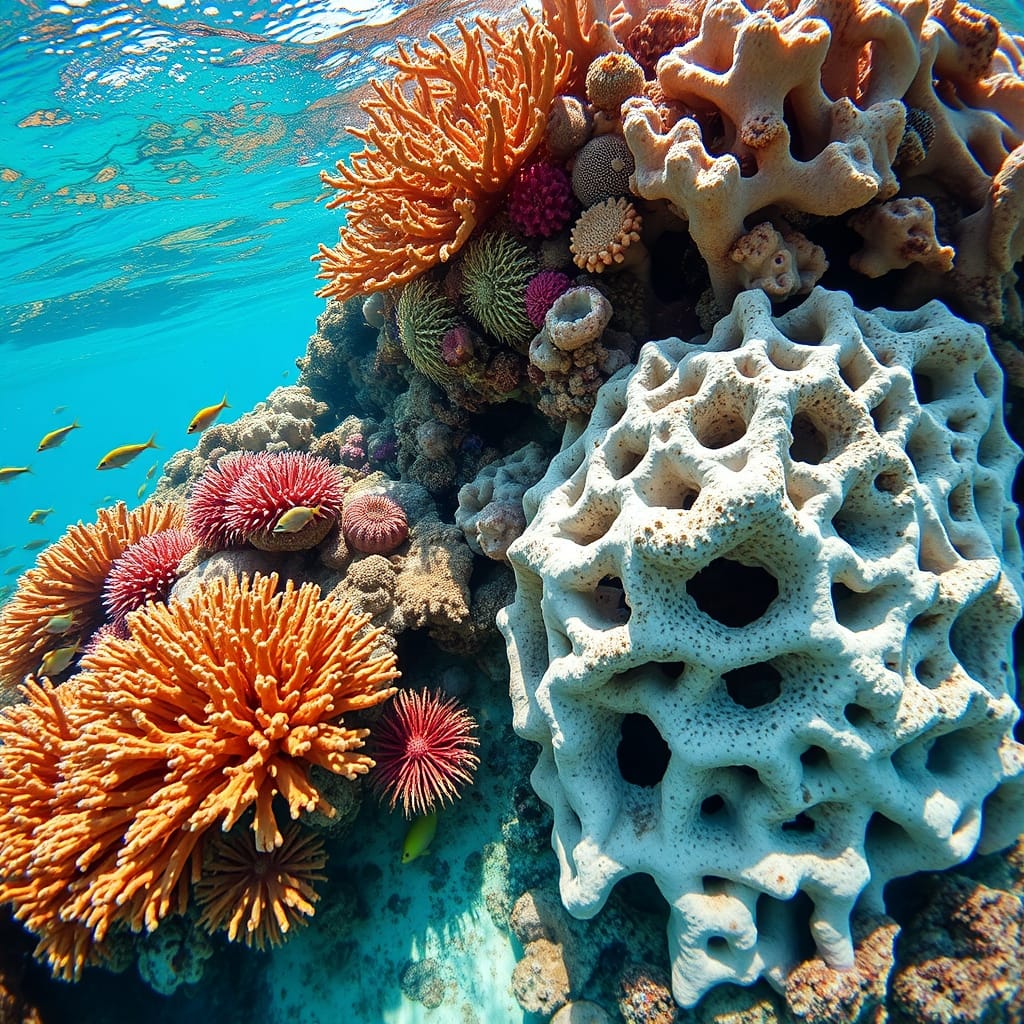
Reef-building corals (scleractinians) secrete aragonite skeletons. Laboratory and field studies consistently show that calcification rates decline as pH drops and aragonite saturation falls. Lower calcification means thinner, more fragile skeletons that are more susceptible to physical damage and bioerosion. Combined with thermal bleaching—where corals expel their symbiotic algae (zooxanthellae) under heat stress—acidification creates a compounding threat. The two stressors together are more damaging than either alone.
Pteropods and Planktonic Calcifiers
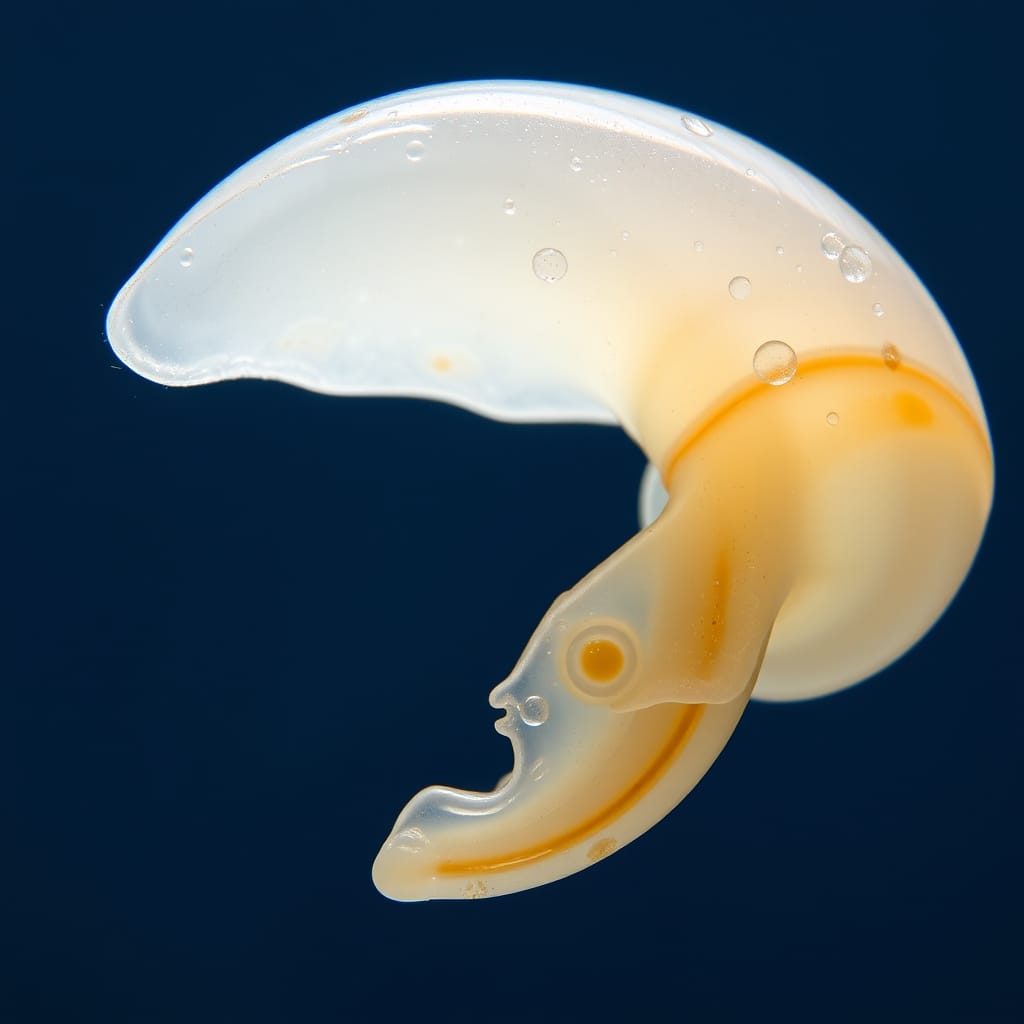
Pteropods, sometimes called sea butterflies, are tiny mollusks that form a critical link in polar and sub-polar food webs, feeding fish, whales, and seabirds. Their thin aragonite shells dissolve measurably in waters already being observed in the Southern Ocean and North Pacific. Studies have documented shell dissolution and reduced shell thickness in wild pteropod populations collected from naturally more acidic upwelling zones.
Oysters, Mussels, and Clams
Bivalve larvae are particularly sensitive during the early calcification stage. Hatcheries on the U.S. West Coast experienced significant larval die-offs in the late 2000s, later attributed in part to the upwelling of corrosive, low-pH water onto the continental shelf. This was one of the first commercially documented economic impacts of ocean acidification on a fishery.
Fish and Invertebrates with Less Calcification
Some fish species show behavioral and physiological effects at elevated CO₂ levels—including altered olfactory responses and changes in predator avoidance—though these effects are more variable and less well-established than the impacts on calcifying organisms. Certain species of sea urchins and crabs show reduced growth or reproductive success, while others appear more tolerant, partly due to their ability to regulate internal pH.
Ecosystem-Level Consequences
Marine food webs are built on interconnections, so impacts on one group ripple outward. If pteropod populations decline in polar regions, the fish and marine mammals that depend on them face reduced prey availability. If coral reefs degrade structurally, the hundreds of thousands of species that rely on reef habitat for shelter and breeding lose critical ecosystem services.
Phytoplankton—the base of most marine food chains—show mixed responses. Some coccolithophores (calcifying phytoplankton) produce thinner plates under high CO₂, while others appear to calcify more. Non-calcifying phytoplankton may benefit from higher dissolved CO₂ in some conditions. The net effect on primary productivity and community composition remains an active area of research.
Seagrass meadows and kelp forests, by contrast, may benefit locally from elevated CO₂ through enhanced photosynthesis, but these gains do not compensate for the broader losses in calcifying communities.
Regional Hotspots
Ocean acidification is not uniform. Several regions face disproportionate risk:
- Arctic Ocean: Cold water dissolves more CO₂, and freshwater input from melting ice dilutes the buffering capacity of seawater. Aragonite undersaturation is projected to become widespread seasonally within decades.
- Eastern Pacific upwelling zones: Deep, CO₂-rich water naturally upwells along the U.S. West Coast and off Chile, and anthropogenic CO₂ has made this water more corrosive. Oyster hatcheries in Oregon and Washington have already been affected.
- Tropical coral reef regions: Already near the lower limit of aragonite saturation needed for reef growth, tropical reefs face a narrowing window as pH continues to fall.
- Southern Ocean: High biological productivity and deep mixing make this region a major CO₂ sink, and pteropod shell dissolution has been documented here.
Projections Under Different Emissions Scenarios
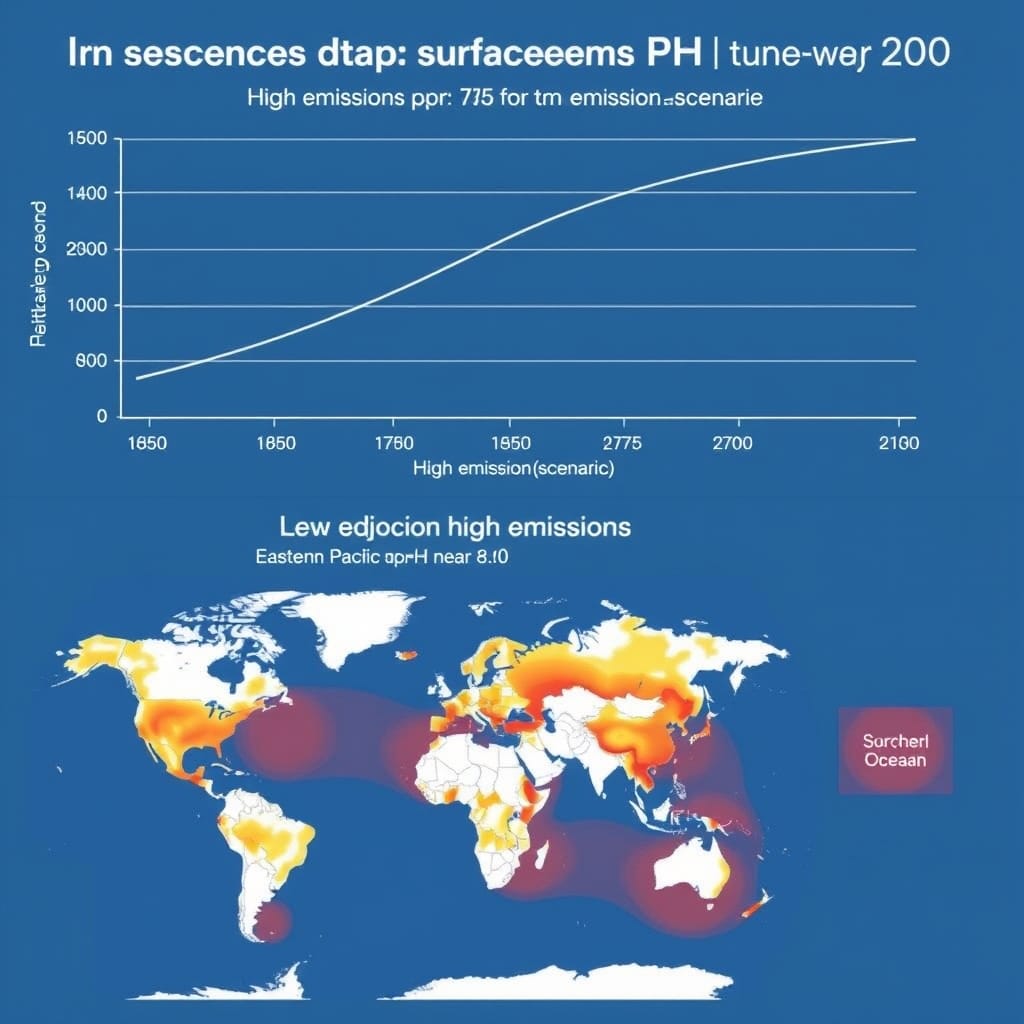
Under a high-emissions scenario (SSP5-8.5), models project average surface ocean pH could fall to around 7.7–7.8 by 2100—a total decline of roughly 0.4 units from pre-industrial levels, representing a 150% increase in hydrogen ion concentration. Under a low-emissions scenario consistent with limiting warming to 1.5–2°C (SSP1-2.6), pH decline could be limited to approximately 0.1–0.2 additional units.
The difference between these trajectories is enormous for marine ecosystems. Coral reef systems are generally considered at high risk of functional collapse under high-emissions scenarios, while moderate mitigation could preserve significant reef coverage, though not without substantial change.
It is important to note that even if CO₂ emissions were halted today, ocean pH would not recover quickly. The ocean-atmosphere system equilibrates over centuries to millennia, meaning that some degree of continued acidification is already committed.
Monitoring and Research Methods
Scientists track ocean acidification using a combination of approaches:
- Argo floats and moored buoys: Autonomous sensors measure pH, dissolved oxygen, and temperature across ocean basins continuously.
- Ship-based surveys: Research cruises collect water samples for precise carbonate chemistry analysis, including measurements of dissolved inorganic carbon (DIC) and total alkalinity.
- Coral cores and sediment records: Boron isotope ratios in ancient coral skeletons and foraminifera shells serve as proxies for past ocean pH, extending the record back millions of years.
- Mesocosm experiments: Controlled enclosures in the ocean or laboratory allow researchers to expose communities of organisms to projected future CO₂ levels and observe responses over weeks to months.
The Global Ocean Acidification Observing Network (GOA-ON) coordinates international monitoring efforts to ensure consistent, comparable data across regions.
Can Anything Be Done?
The only durable solution to ocean acidification is reducing atmospheric CO₂ emissions. Local interventions exist but are limited in scale:
- Alkalinity enhancement: Adding crushed silicate minerals or lime to seawater raises its buffering capacity, potentially protecting local areas. This is being studied experimentally but has not been deployed at meaningful scale.
- Seagrass and kelp restoration: Photosynthetic marine vegetation locally removes CO₂ and raises pH in surrounding water during daylight hours, offering refugia for sensitive species. The effect is local and temporary.
- Hatchery management: Shellfish hatcheries on the U.S. West Coast now monitor incoming water chemistry and time larval exposure to avoid the most corrosive upwelled water, demonstrating that adaptive management can reduce near-term economic harm.
- Marine protected areas: Reducing other stressors—overfishing, pollution, coastal runoff—improves ecosystem resilience, giving species a better chance of coping with acidification.
Large-scale ocean-based carbon dioxide removal approaches, such as ocean iron fertilization or direct ocean capture, remain experimental and carry their own ecological uncertainties.
Key Takeaways
- Ocean acidification is caused by the absorption of atmospheric CO₂, which forms carbonic acid and lowers seawater pH.
- Surface ocean pH has already fallen by about 0.1 units since pre-industrial times—a 26% increase in hydrogen ion concentration.
- The primary mechanism of biological harm is the reduction of carbonate ion availability, which impairs shell and skeleton formation in corals, mollusks, and other calcifying organisms.
- Pteropods, oysters, and reef-building corals are among the most vulnerable groups; some fish and non-calcifying species show more variable responses.
- The Arctic, Eastern Pacific upwelling zones, and tropical coral reefs are regional hotspots facing the earliest and most severe impacts.
- Projections diverge sharply by emissions scenario: high emissions could push pH to 7.7–7.8 by 2100; strong mitigation could limit further decline to 0.1–0.2 units.
- Local interventions can reduce harm at small scales, but reducing CO₂ emissions is the only solution that addresses the root cause.
Conclusion
Ocean acidification is one of the most chemically straightforward consequences of rising atmospheric CO₂, and its biological implications are increasingly well-documented. The ocean’s carbonate chemistry is shifting at a pace unprecedented in the geological record, and the organisms most dependent on that chemistry—corals, shellfish, and the food webs built around them—are already showing measurable responses. The trajectory over the rest of this century depends heavily on how quickly global emissions are reduced. Understanding the mechanisms, the regional variation, and the limits of local adaptation is essential for both conservation planning and honest public communication about what is at stake in the ocean beneath the surface.
Sources & Further Reading
The following sources provide primary data, synthesis reports, and peer-reviewed research supporting the information in this article.
Sources & Further Reading
Authoritative sources used for background, evidence and further reading:
- Ocean Acidification – NOAA Ocean Acidification Program
- The Oceanic Sink for Anthropogenic CO2 – Science (Sabine et al., 2004)
- Ocean Acidification – IPCC AR6 Working Group I Chapter 5
- Global Ocean Acidification Observing Network (GOA-ON)
- Impacts of Ocean Acidification on Marine Organisms – NOAA PMEL Carbon Program
- Saturation State of Seawater with Respect to Aragonite and Calcite – NOAA NCEI
- Pteropod Shell Dissolution in a High-CO2 World – Nature Geoscience (Orr et al., 2005)
- Ocean Acidification: Starting with the Science – Woods Hole Oceanographic Institution
- Carbonate Chemistry of the Ocean – Scripps Institution of Oceanography CO2 Program
- State of the Climate: Ocean Acidity – American Meteorological Society
Disclaimer
This article is provided for general educational and informational
purposes only. Scientific and technical understanding can change as new
evidence becomes available. The information presented here should not be
treated as a substitute for qualified professional advice or independent
verification when important decisions depend on it. Readers are encouraged
to consult the cited authoritative sources for additional context.